
Sampling Scheme
Published:
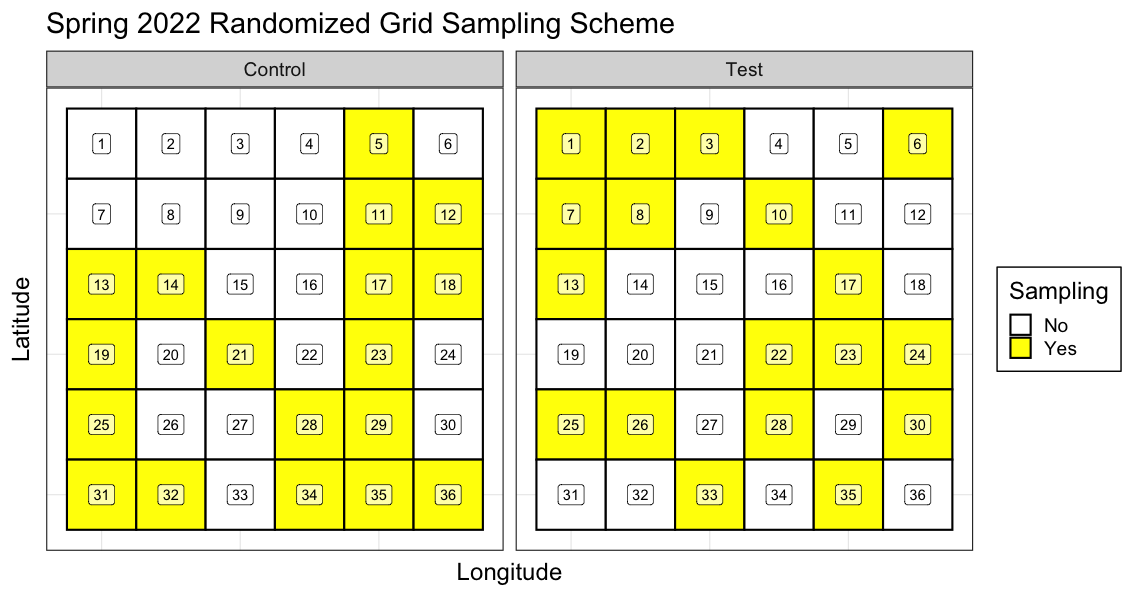
This is a graphical representation of the spring 2022 commercial trapping survey’s randomized sampling design. The sampling design was selected using the same method used in the fall 2021 survey planning. Code for the randomized selection is as follows:
# Code to randomly select aliquots for Spring 2022 Commercial Trap Survey sampling.
# Everett Rzeszowski
# April 14, 2022
rm(list = ls())

library(tidyverse)

# Model grid values
grid = seq(1,36,1)

# Spring 2022 Site Selection
set.seed(53)
(s1 <- sample(grid, 18, replace = F)) # Test
set.seed(23139)
(s2 <- sample(grid, 18, replace = F)) # Control
The data is then organized into a tibble. It was easiest for me to assign sample values to the test and control sites seperately and then combine the two tibbles because the grid indexes repeat for each site.
# Tibble the sampling data
sample.structure.test = tibble(grid = rep(seq(1,36)),
                               row = rep(seq(6,1), each= 6),
                               col = rep(seq(1,6), 6),
                               sample = rep(0,36))

sample.structure.control = tibble(grid = rep(seq(1,36)),
                                  row = rep(seq(6,1), each= 6),
                                  col = rep(seq(1,6), 6),
                                  sample = rep(0,36))


sample.structure.test$sample[intersect(sample.structure$grid[sample.structure$array == 'Test'],s1)] <- 1
sample.structure.control$sample[intersect(sample.structure$grid[sample.structure$array == 'Control'],s2)] <- 1

sample.structure <- bind_rows(sample.structure.test,sample.structure.control)
sample.structure$array <- rep(c('Test','Control'), each= 36)
sample.structure$sample <- factor(sample.structure$sample, labels = c('No','Yes'))
To finish this short script the relative grid sampling locations of each site are graphically represented producing the above figure which was saved at 1133 × 597 px.
# Graphically represent
sample.structure %>%
  ggplot(aes(col, row, fill = sample)) +
  facet_grid(cols = vars(array)) +
  geom_tile(color = 'black',
            lwd = .75) +
  geom_label(aes(label = round(grid)),fill="white",alpha=0.65) +
  scale_fill_manual(values = c('white','yellow')) +
  theme_bw(base_size = 18) +
  labs(x= 'Longitude',
       y= 'Latitude',
       title= 'Spring 2022 Randomized Grid Sampling Scheme',
       fill= 'Sampling')+
  theme(panel.grid.major.x = element_blank(),
        panel.grid.major.y = element_blank(),
        axis.text.x = element_blank(),
        axis.text.y = element_blank(),
        axis.ticks.x = element_blank(),
        axis.ticks.y = element_blank(),
        legend.background = element_rect(colour= 'black', linetype = 'solid', size= 0.5))